Simplot Weather
Hyper-localized weather app for agronomists powered by field station data
Overview
Simplot needed a way to surface weather data from their growing network of field-based weather stations directly to agronomists. Existing weather apps provided regional forecasts, but lacked the hyper-local precision that agricultural decision-making requires. A farmer needs to know exactly what's happening at their specific field, not what's happening five miles away.
The work spanned the full product surface:
- Native mobile app for iOS
- Light and dark mode experiences
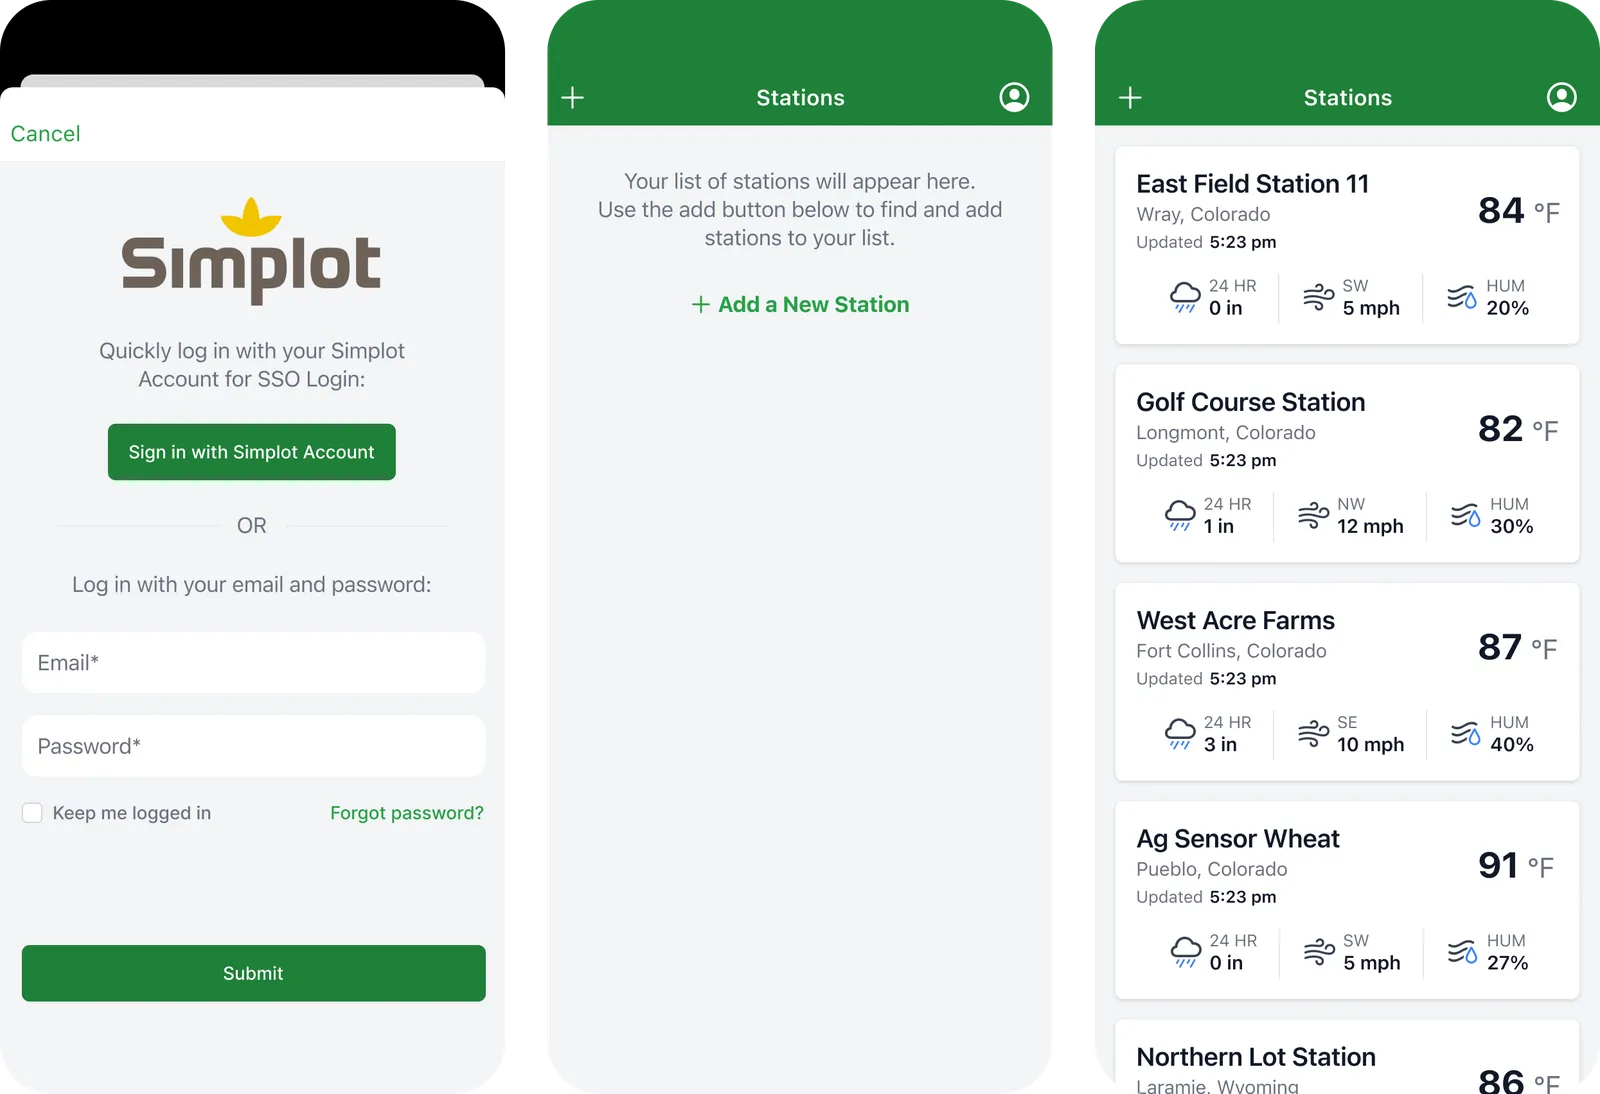
- Station selection and favoriting system
- Real-time weather data visualization for agricultural metrics
- Hyper-localized weather monitoring for multiple field locations
Team & Role
My role
- Product designer across the full app experience
- Designed station selection, favoriting, and weather data visualization
- Optimized for field conditions with light and dark modes
- Gathered feedback from business stakeholders and field teams
Team
- Product manager
- 1 Mobile developer
- Business stakeholders and field team feedback
From Concept to Launch
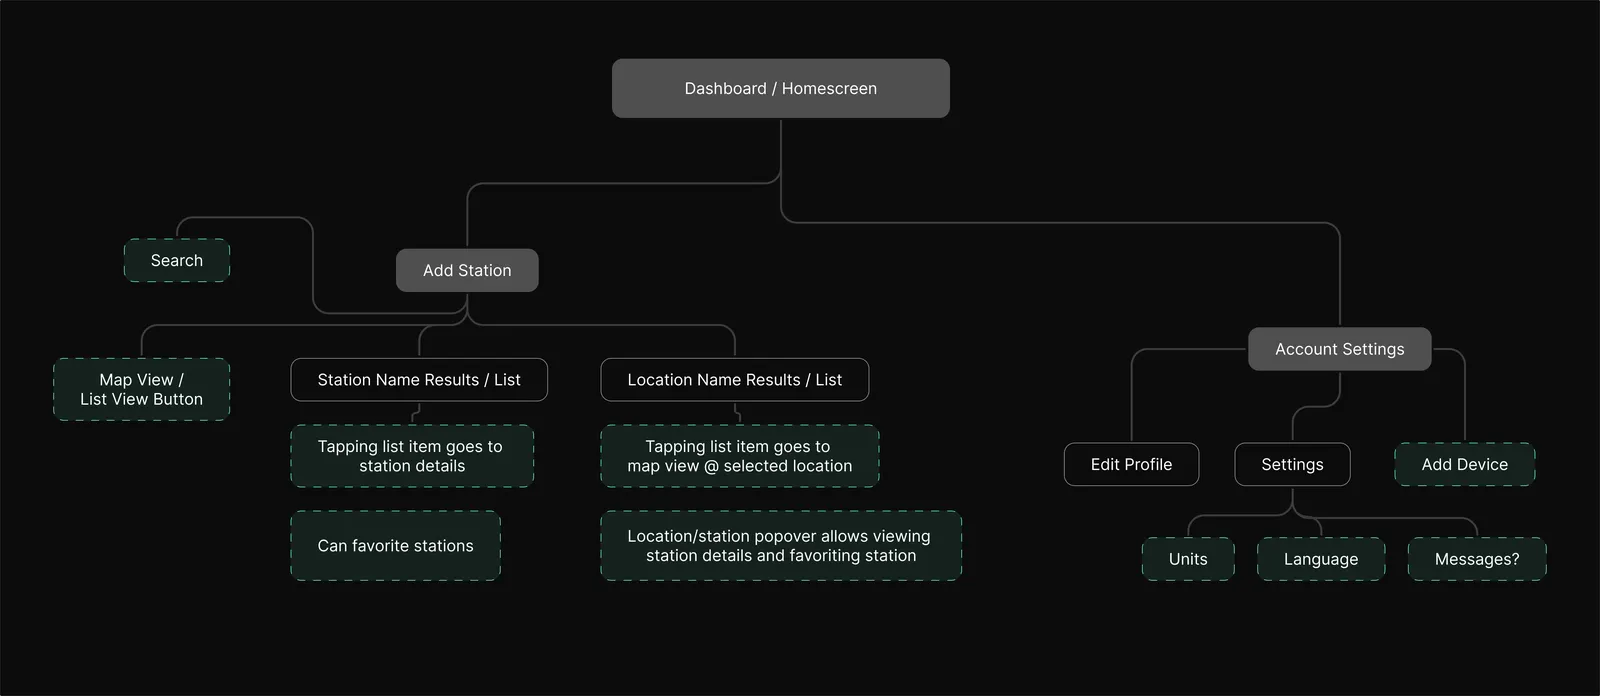
This project moved fast. Working closely with one developer and one PM, I designed the core experience in under a month, gathering feedback from business stakeholders and field users with tight iteration loops. The short timeline meant prioritizing ruthlessly focusing on the core value proposition of hyper-localized data and station favoriting.
Designing for field conditions
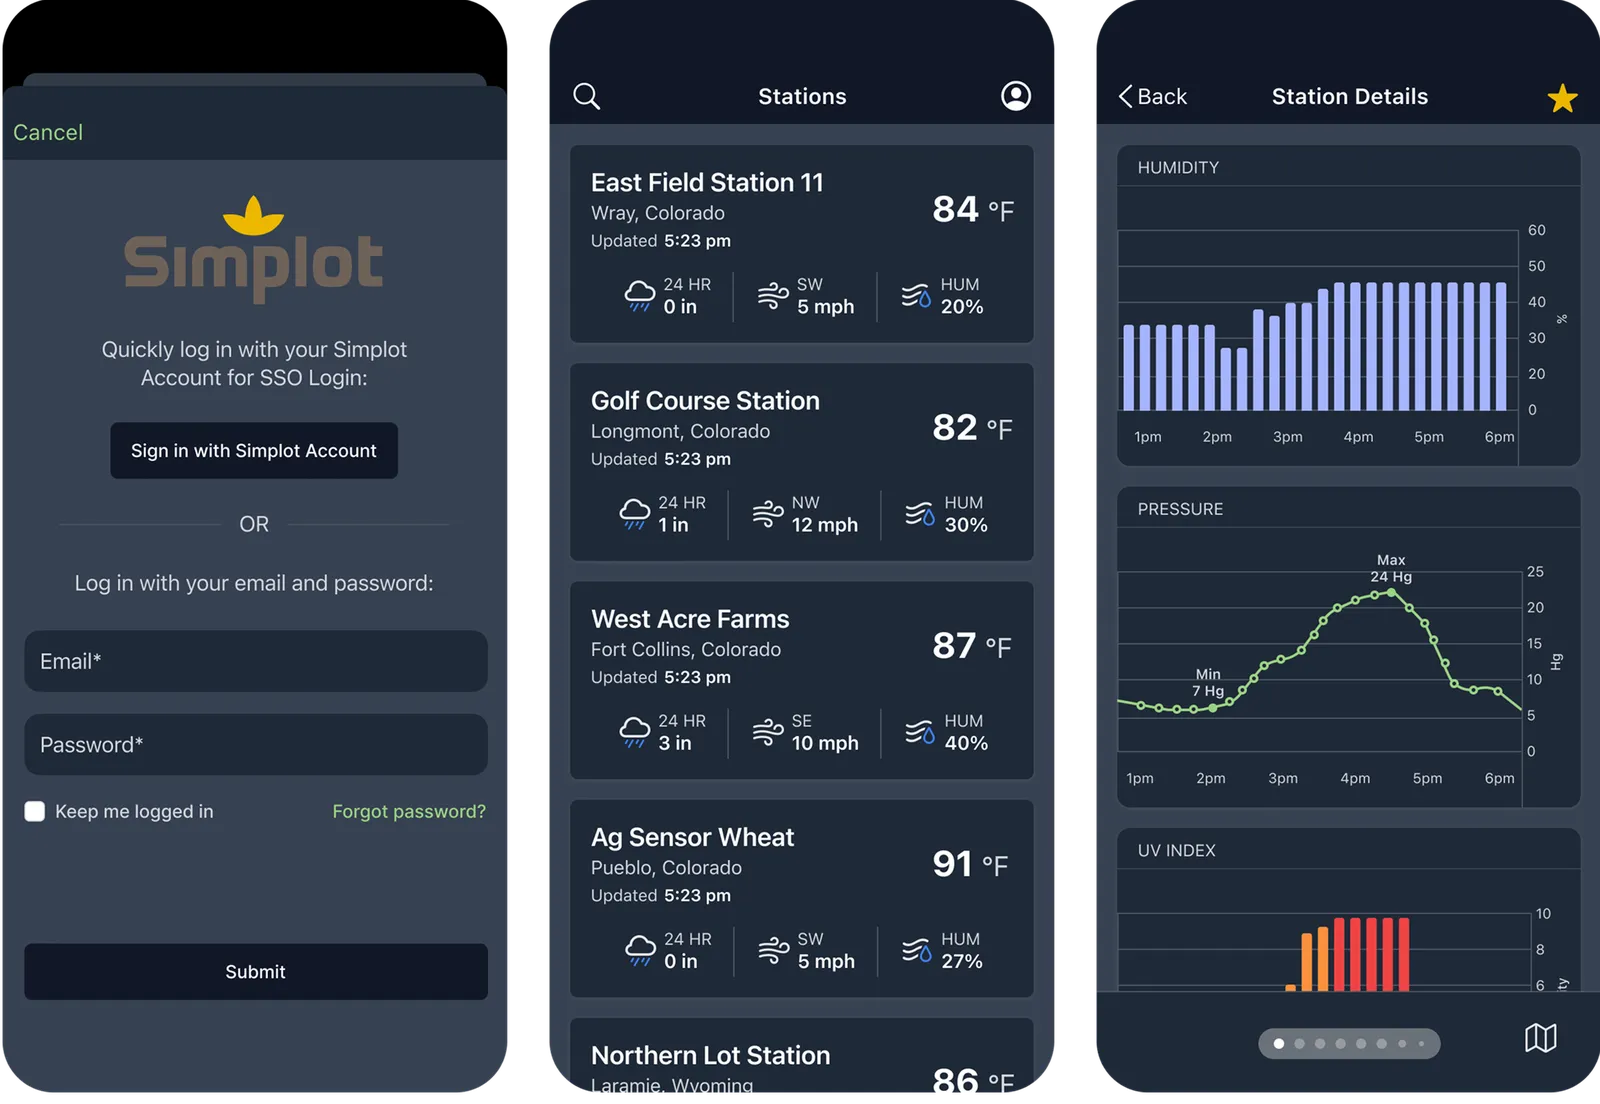
I designed light and dark mode experiences optimized for outdoor use. Agronomists often check weather conditions in bright sunlight or early morning darkness, so both modes needed strong contrast and readability. I also kept the interface simple and glanceable, as users needed to quickly check conditions without navigating through complex menus.
Station selection and favoriting
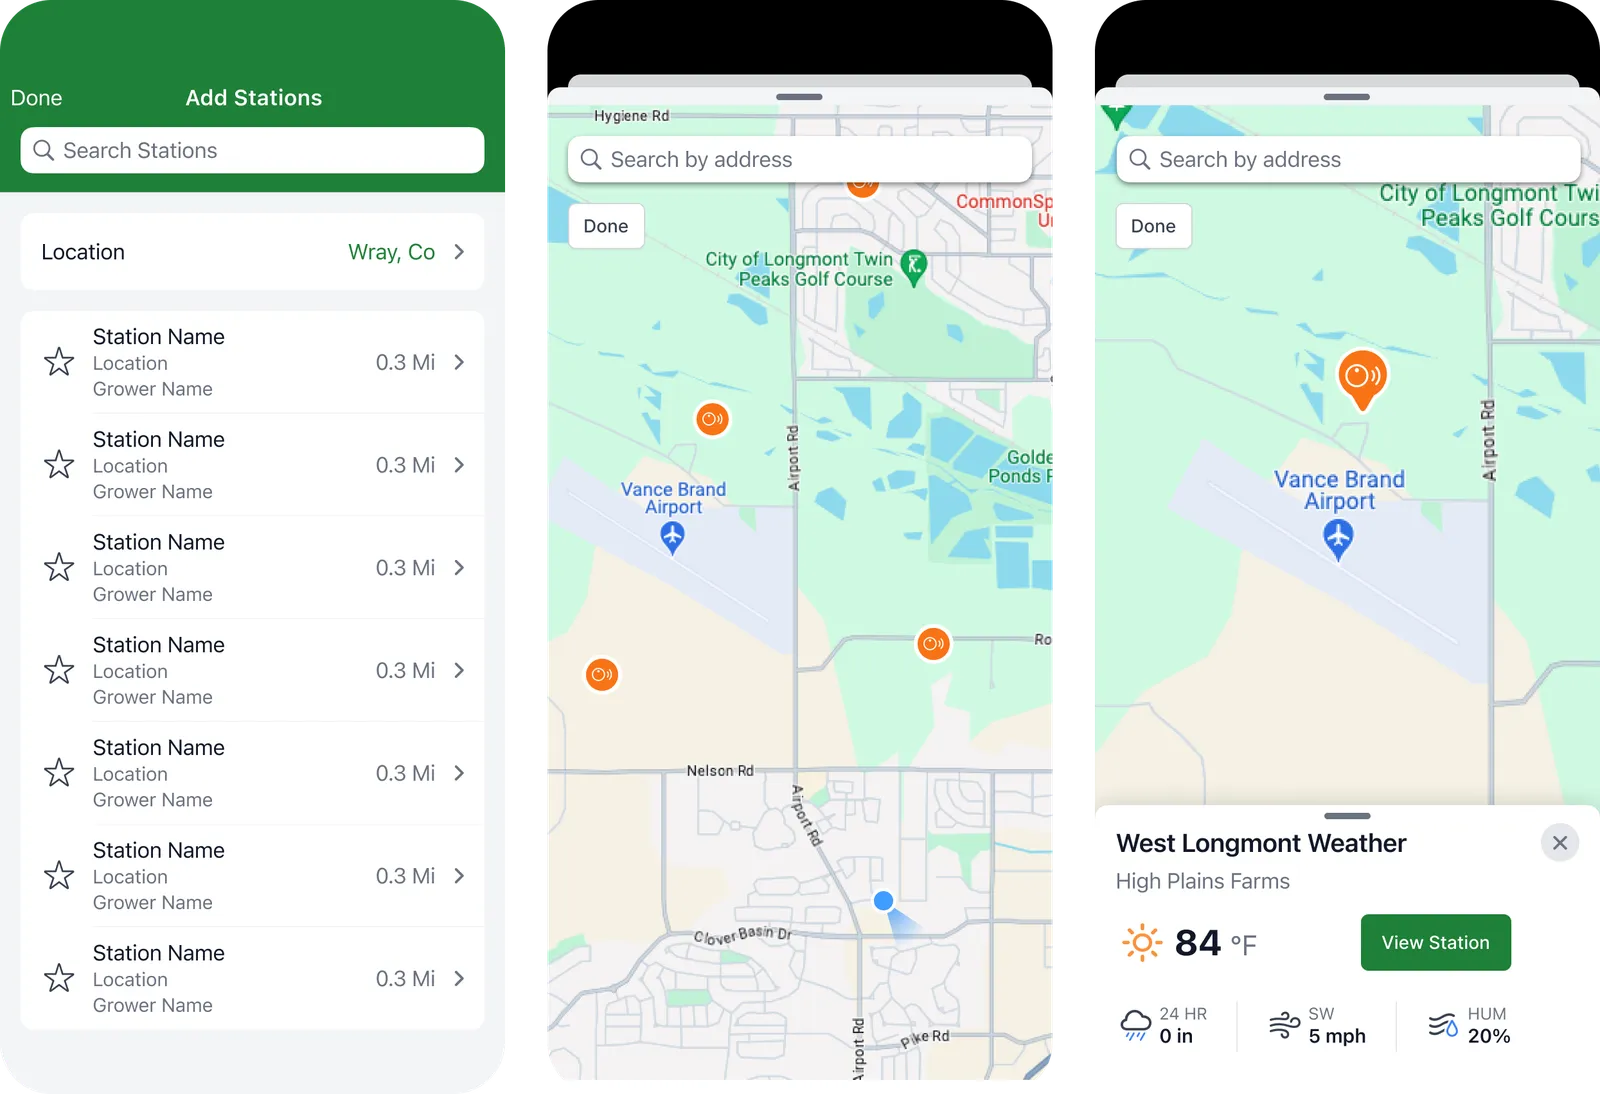
The core interaction was allowing users to find nearby Simplot weather stations, save their preferred locations, and quickly switch between them. I designed a map-based station browser and a favoriting system that let users build a personalized dashboard of their most important fields.
Agricultural weather metrics
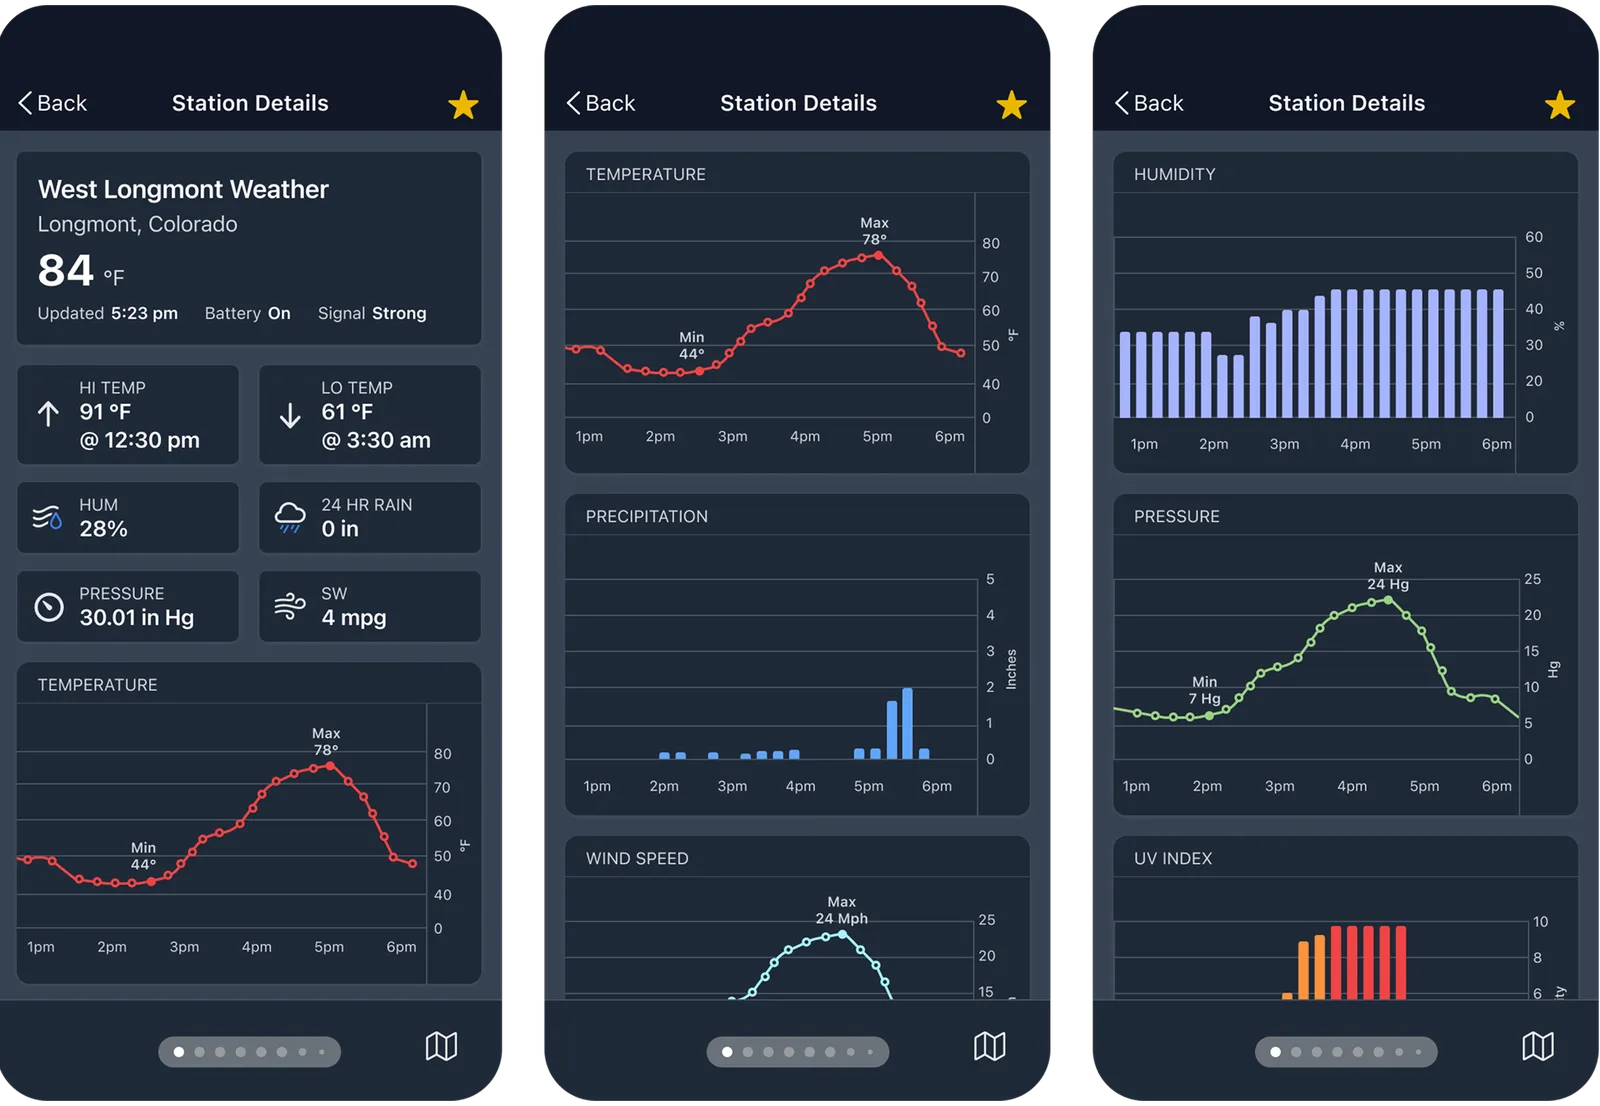
I worked with the team to determine which weather metrics mattered most for agricultural decisions: temperature, precipitation, wind speed, humidity, and UV index. I designed data visualizations that surfaced current conditions clearly while providing enough historical context for trend analysis.
Results
- Successfully launched experimental pilot within Simplot
- Widely adopted by field teams and agronomists
- Recognized as one of Simplot's most successful recent pilot projects
- Validated demand for hyper-localized weather data in precision agriculture
The pilot was a huge success. Field teams and agronomists quickly adopted the app, and it became one of Simplot's most successful recent experimental projects. The fast turnaround validated both the demand for hyper-localized weather data and the value of Simplot's weather station network.